For the past several months, satellite data of our atmosphere are showing sky high levels of methane emissions in the regions of the Arctic.
Lower resolution image summaries of the data are produced for every 12 hour period, and are being downloaded and processed by some technically able and interested people. I found a summary data source here (http://www.osdpd.noaa.gov/IASI/)
As the NOAA site explains, the Infrared Atmospheric Sounding Interferometer (IASI), is a hyperspectral infrared sounder residing on the European Space Agencys (ESA) MetOp series of polar orbiting satellites. In simpler terms, they produce pictures of the atmosphere, of about 100 different air pressure layers. (in units of millibars, mb). In the infrared frequency range, each layer shows measures of temperature and greenhouse gas "mixing rations", including water vapour, carbon dioxide and methane.
Methane concentrations have been found to be rising much higher that the global average over large areas of the Arctic. The image data is colour pixel coded for the range of levels measured. Thanks to the work of "The Methane Tracker" web-site, the original images are archived and can be downloaded for any given date and atmosphere layer at http://www.methanetracker.org/Data/OriginalCH4MixingRatioImagesfromIASI.aspx
The overall, very strong "signal" that we are getting from these global pictures, is that over Arctic regions there are multiple sources of underwater methane out-gassing through the many gaps in the thinning ice. Defrosting permafrost, and large volumes of undersea methane clathrates are blamed. Methane has good absorption of particular infrared energy frequencies. It traps reflected solar heat, and over the Arctic it seems that it tends to rise and accumulate in the middle layers of the atmosphere. Its a dynamic process, and the extra methane eventually is mixed and distributed elsewhere and converted to CO2 from oxidation. The suggestion is that it contributes to extra warming over the Arctic, which is an amplifying feedback.
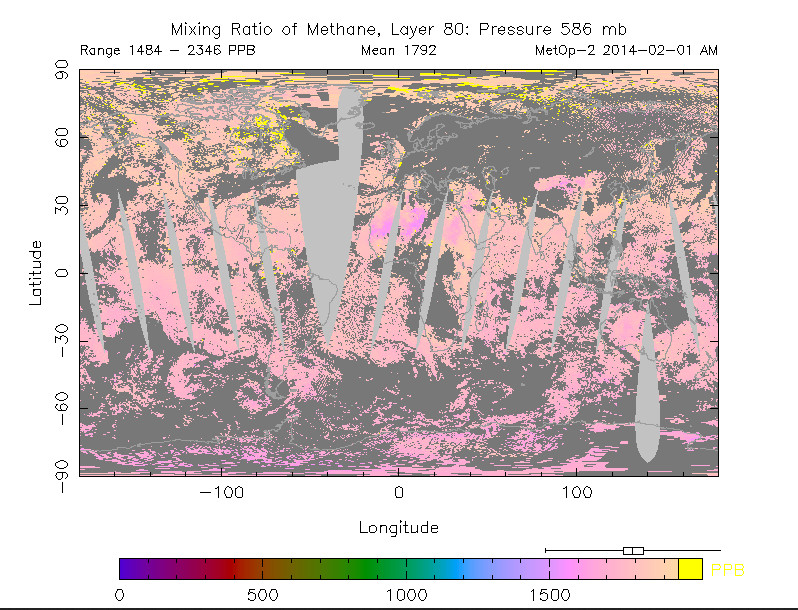
It is hard to draw exact quantitative conclusions. Gray pixels are regions not measured (light) , or measurements that were eliminated. The bright yellow bits over the arctic, representing levels far over the global average are now a persistent feature. Generally over time period the data has been published, high levels over a region have been correlated with actual methane producing events. There are known measurement uncertainties in the data gathering process. The data results have been confirmed by independent measurements done by aircraft flights, and the signals from the collections of pictures are strong enough to pick out with your eyes, which is why the results are colour coded.
Methane is a very strong greenhouse gas, at these levels, a proportional increase produces some 80 times the greenhouse warming effect than the same carbon increase in CO2. The methane is transient, being oxidised to CO2 over a half life period of something like 10 years. A doubling of methane will take a much shorter time than a doubling of CO2, if the rates of supply from the defrosting northern hemisphere increase.
The significance of the findings is part of the overall picture of our warming globe. The Arctic region is warming the fastest, reducing the average difference in temperatures between the poles and the equator, resulting in new patterns of global weather. The total ice volume is shrinking year by year, and may be gone entirely in the summer by 2016. The increased peri-Arctic methane is an unwelcome and additional amplifier of global warming. The changes in the Arctic are the global alarm that we have pushed our carbon dioxide additions to the atmosphere far beyond safe limits. Methane release from Arctic ocean shelves, from plumes of methane in shallow arctic sea shelves, and from melting permafrost regions has already been confirmed by on the ground and sea-level evidence. Further updates and comments on our self-induced peril can be found at http://arctic-news.blogspot.com.au/
Add Comment
This policy contains information about your privacy. By posting, you are declaring that you understand this policy:
This policy is subject to change at any time and without notice.
These terms and conditions contain rules about posting comments. By submitting a comment, you are declaring that you agree with these rules:
Failure to comply with these rules may result in being banned from submitting further comments.
These terms and conditions are subject to change at any time and without notice.
Comments